Sunday, November 29, 2009

Dubai Crisis For Dummies: Basics & Implications For Stocks & Global Markets

NB: The below is a basic quick review of the Dubai Crisis and Its Meaning For Stocks

Key Points to Note

The biggest near term influence on the direction of risk appetite and global markets appears likely to be the Dubai debt crisis, so we need to evaluate the importance of this past week’s credit scare.
The request to delay repayment on its loans by Nakheel (a real estate development arm of Dubai's development fund Dubai World) confronts markets with what is potentially the largest sovereign default since the 2001/2002 when Argentina stopped payments on its government bonds. The Dubai default threat does not have the same fundamental complexities as its Argentina's did, however, context and timing can be everything.

Given that markets are:

  • Sitting atop an extended rally on questionable fundamentals and valuations
  • Nervously remembering how two years ago, a supposedly containable US real estate default crisis metastasized into a near worldwide financial and economic collapse from which they are still trying to recover
a far more dramatic response from the dollar and nearly every other asset class is quite conceivable, thank you.

Market concerns include:

  • There could be “contagion”-type effects that could affect the creditworthiness of related entities, particularly those that have lent to Dubai World. Most of those are either UAE-related or European banks. This isn’t a huge issue, unless it becomes a big European issue — unlikely, but remember that European banks are even more levered than US banks. It's believed that UK's RBS, HSBC, Barclays, Lloyds and Stand Chartered are having large exposures in case of defaults. Who would be affected if these were undermined?
  • Secondary aftershocks to would be entities similar to Dubai — other places in the world that have borrowed a lot (Greece, Ireland, Iceland, parts of Eastern Europe, etc). Thus many emerging markets are getting hit in this mini-crisis by rising borrowing costs.
  • More borrowing to solve the Dubai crisis makes another one more likely.
  • What investors should remember is that in ordinary circumstances (peace, absence of famine, plague, or rampant socialism), the economies tend to grow at about 2%/year. One can try to increase that by borrowing, and at the right opportunity that can be a winner. But most of the time, huge increases in debt levels are eventually associated with default. In a highly leveraged financial system where lenders are themselves indebted, defaults can cascade. As markets get more risk averse and credit tightens (i.e. rates rise to compensate for perceived increased risk) various government ministers/bureaucrats come forth and say, “There is nothing fundamentally wrong here. All we need is to restore confidence. This is not a solvency issue, it is a liquidity issue!” They answer by taking on more debt to free up liquidity.
  • Risk that an isolated default can spread then rises, as an increasingly leveraged financial system comes more and more to resemble a massive arrangement of dominoes. The more leverage on any entity, the taller that domino. The more leverage in the system, the more tightly the dominoes are spaced. That arrangement collapses when someone knocks over a key domino.
Now, most analysts believe that this situation is contained, and after falling hard for the two prior days, European markets are rallying today, including financials. Values for debts closely related to Dubai World have fallen hard, and S&P and Moody’s have downgraded them, and may declare the payment delay to be a default. (Also, with credit to Moody’s — they did downgrade many Dubai-related entities earlier this month. Remember, with rating agencies, smart investors ignore the ratings, and look at what the analyst says. The Moody’s analyst highlighted the lack of any explicit guarantees from Dubai.)
In the week ahead, the key to gauging price action for the broader financial markets and the USD will lie with the market’s ultimate response to the Dubai crisis. There hasn't been enough time to see market’s true response to the threat. The incredible volatility through the end of last week was certainly leveraged by the thin liquidity from the US holiday.
Indeed, the timing of Dubai World's announcement coincidentally (?) allowed an incredible short term profit opportunity for anyone with advanced notice, and to minimize the time markets had for panicking before taking a weekend break to calm down and perhaps minimize the chances of an even more extreme reaction. Liquidity was extremely low at the time of the Nov 25th-26th announcement, with both the US and Islamic World their respective Thanksgiving and Eid holidays. Thus the volatility generated by this market moving news was exaggerated by the small number of traders available.
The demand for safe-haven dollar shorts unwound was so strong that the euro hit an intraday low of 1.4829 when the European markets opened. The price action in USD/JPY tells us that risk aversion was the primary driver of the forex markets as USD/JPY dropped to a 14 year low when the Asian markets opened last night.
Perhaps very significantly for the coming week, the selling did not continue into the U.S. trading session. The limited number of U.S. traders Friday actually sold rather than bought dollars which suggests that not everyone believes that the Dubai news will have immediate global ramifications, because the first reaction to a major surprise announcement like this one is always sell first and ask questions later. As a result, the USD and JPY were the biggest winners. That USD buying didn't continue into Friday suggests markets might open Monday on a more positive note.
Indeed, when the deep pockets return to the market after having had a weekend evaluate things, it will be easier to establish true trends as there will be a source for momentum.
While we can't say for certain whether this is the beginning of a longer term reversal in risk assets, some tentative conclusions can be drawn.

Additional Points to Consider

As noted above, a major surprise risk event like the Dubai news is one of the few things that might set a near term bottom in the U.S. dollar as its safe haven status overrides its still poor fundamentals. On the eve of November 25th, the Thanksgiving Holiday in the U.S. and the Eid Holiday in the Middle East, Dubai World shocked the markets by saying that its property developer Nakheel has requested to delay its Dec 14 debt payments. While Dubai World is not technically owned by the Dubai government, its liabilities of US$59 billion is a significant amount of the total estimated US$80-100 billion in Dubai's liabilities.
As a result, investors fear that this could mean an outright default on Nakheel's debt, because delinquency is usually the precursor default. Although the market believes that this is a major development for the global economy, it is important to realize that Nakheel's debt is only $3.52 billion, a fraction of Dubai World's overall debt. Also, U.S. and European banks have very small exposure to Nakheel’s debt, though it's not fully clear who has what exposure, and how well they can absorb possible losses.
However, markets heard the same kind of talk at the start of the US sub-prime lending crisis, and realize that these things can quickly snowball into far bigger problems.
Granted a default may entitle investors to some of Dubai World's assets, H.H Sheikh Ahmed bin Saeed Al-Maktoum, Chairman of the Supreme Fiscal Committee, has already issued a statement confirming the Dubai Government's intention to directly intervene and manage the restructuring of Dubai World commercial operations and its debt obligations. Although some people are afraid that this could turn into an Argentina style debt default or a repeat of volatility of Q4 2008, what is more worrisome is the fact that this may be indicative of the health of the entire property sector in the Middle East. Which global banks are deeply exposed there?

STOCKS

Analysis: Apart From Dubai, Pullback Potential Was Already Present & Watch for Black Friday Results
Even before Dubai threatened markets with the largest sovereign credit default since Argentina in 2001, a larger underlying shift in global capital markets likely already began in October. In addition to Dubai, consider the already extant pressures on risk appetite.
  • Morgan Stanley index of world stock prices fell the most in eight months while
  • The VIX Index, a stand-by measure of investors’ fear, rose the most in a year.
  • The S&P 500 remains unable to sustain a break above multi-week resistance at 1100, and any failure by world leaders to calm markets soon will harden that resistance.
  • The financial system's resistance to further crises has been weakened by the crisis of the past two years, with central banks already burdened with debt. Relative equity valuations have looked excessive for some time now with prices trading at the highest levels relative to earnings in seven years.
  • Further, the market’s mood seems to be in transition, with the relief that collapse had been averted, which produced the risk rally of recent months, giving way to concerns about valuations and what happens when interest rates invariably reverse course higher and the flow of government cash dries up.
  • Companies’ “better than expected” earnings of the past several quarters have relied heavily on, cost cuts, usually from firing workers. Ultimately this means lost consumer demand.

Commodities

If the crisis appears to spread (and this could take time to play out, similar to the US subprime crisis), most will drop back. This includes gold, unless fear of another threatened global collapse occurs, which could favor gold.

Currencies

If the crisis lingers on, or markets pull back for some other reason (there are potentially many), the JPY, USD, and CHF will be the big likely winners. The AUD, NZD, CAD, and EUR would retreat against these.
DISCLOSURE: NO POSITIONS IN THE ABOVE

The Dubai Crisis For Idiots: Basics & Implications For Stocks & Global Markets

NB: The below is a basic quick review of the Dubai Crisis and Its Meaning For Stocks. Those seeking full details should visit: http://fxmarketanalysis.wordpress.com  or http://worldmarketsguide.blogspot.com

Key Points to Note

The biggest near term influence on the direction of risk appetite and global markets appears likely to be the Dubai debt crisis, so we need to evaluate the importance of this past week’s credit scare.

The request to delay repayment on its loans by Nakheel (a real estate development arm of Dubai's development fund Dubai World) confronts markets with what is potentially the largest sovereign default since the 2001/2002 when Argentina stopped payments on its government bonds. The Dubai default threat does not have the same fundamental complexities as its Argentina's did, however, context and timing can be everything.

Given that markets are:

  • Sitting atop an extended rally on questionable fundamentals and valuations
  • Nervously remembering how two years ago, a supposedly containable US real estate default crisis metastasized into a near worldwide financial and economic collapse from which they are still trying to recover

a far more dramatic response from the dollar and nearly every other asset class is quite conceivable, thank you.

Market concerns include:

  • There could be “contagion”-type effects that could affect the creditworthiness of related entities, particularly those that have lent to Dubai World. Most of those are either UAE-related or European banks. This isn’t a huge issue, unless it becomes a big European issue — unlikely, but remember that European banks are even more levered than US banks. It's believed that UK's RBS, HSBC, Barclays, Lloyds and Stand Chartered are having large exposures in case of defaults. Who would be affected if these were undermined?
  • Secondary aftershocks to would be entities similar to Dubai — other places in the world that have borrowed a lot (Greece, Ireland, Iceland, parts of Eastern Europe, etc). Thus many emerging markets are getting hit in this mini-crisis by rising borrowing costs.
  • More borrowing to solve the Dubai crisis makes another one more likely.
  • What investors should remember is that in ordinary circumstances (peace, absence of famine, plague, or rampant socialism), the economies tend to grow at about 2%/year. One can try to increase that by borrowing, and at the right opportunity that can be a winner. But most of the time, huge increases in debt levels are eventually associated with default. In a highly leveraged financial system where lenders are themselves indebted, defaults can cascade. As markets get more risk averse and credit tightens (i.e. rates rise to compensate for perceived increased risk) various government ministers/bureaucrats come forth and say, “There is nothing fundamentally wrong here. All we need is to restore confidence. This is not a solvency issue, it is a liquidity issue!” They answer by taking on more debt to free up liquidity.
  • Risk that an isolated default can spread then rises, as an increasingly leveraged financial system comes more and more to resemble a massive arrangement of dominoes. The more leverage on any entity, the taller that domino. The more leverage in the system, the more tightly the dominoes are spaced. That arrangement collapses when someone knocks over a key domino.

Now, most analysts believe that this situation is contained, and after falling hard for the two prior days, European markets are rallying today, including financials. Values for debts closely related to Dubai World have fallen hard, and S&P and Moody’s have downgraded them, and may declare the payment delay to be a default. (Also, with credit to Moody’s — they did downgrade many Dubai-related entities earlier this month. Remember, with rating agencies, smart investors ignore the ratings, and look at what the analyst says. The Moody’s analyst highlighted the lack of any explicit guarantees from Dubai.)

In the week ahead, the key to gauging price action for the broader financial markets and the USD will lie with the market’s ultimate response to the Dubai crisis. There hasn't been enough time to see market’s true response to the threat. The incredible volatility through the end of last week was certainly leveraged by the thin liquidity from the US holiday.

Indeed, the timing of Dubai World's announcement coincidentally (?) allowed an incredible short term profit opportunity for anyone with advanced notice, and to minimize the time markets had for panicking before taking a weekend break to calm down and perhaps minimize the chances of an even more extreme reaction. Liquidity was extremely low at the time of the Nov 25th-26th announcement, with both the US and Islamic World their respective Thanksgiving and Eid holidays. Thus the volatility generated by this market moving news was exaggerated by the small number of traders available.

The demand for safe-haven dollar shorts unwound was so strong that the euro hit an intraday low of 1.4829 when the European markets opened. The price action in USD/JPY tells us that risk aversion was the primary driver of the forex markets as USD/JPY dropped to a 14 year low when the Asian markets opened last night.

Perhaps very significantly for the coming week, the selling did not continue into the U.S. trading session. The limited number of U.S. traders Friday actually sold rather than bought dollars which suggests that not everyone believes that the Dubai news will have immediate global ramifications, because the first reaction to a major surprise announcement like this one is always sell first and ask questions later. As a result, the USD and JPY were the biggest winners. That USD buying didn't continue into Friday suggests markets might open Monday on a more positive note.

Indeed, when the deep pockets return to the market after having had a weekend evaluate things, it will be easier to establish true trends as there will be a source for momentum.

While we can't say for certain whether this is the beginning of a longer term reversal in risk assets, some tentative conclusions can be drawn.

Additional Points to Consider

As noted above, a major surprise risk event like the Dubai news is one of the few things that might set a near term bottom in the U.S. dollar as its safe haven status overrides its still poor fundamentals. On the eve of November 25th, the Thanksgiving Holiday in the U.S. and the Eid Holiday in the Middle East, Dubai World shocked the markets by saying that its property developer Nakheel has requested to delay its Dec 14 debt payments. While Dubai World is not technically owned by the Dubai government, its liabilities of US$59 billion is a significant amount of the total estimated US$80-100 billion in Dubai's liabilities.

As a result, investors fear that this could mean an outright default on Nakheel's debt, because delinquency is usually the precursor default. Although the market believes that this is a major development for the global economy, it is important to realize that Nakheel's debt is only $3.52 billion, a fraction of Dubai World's overall debt. Also, U.S. and European banks have very small exposure to Nakheel’s debt, though it's not fully clear who has what exposure, and how well they can absorb possible losses.

However, markets heard the same kind of talk at the start of the US sub-prime lending crisis, and realize that these things can quickly snowball into far bigger problems.

Granted a default may entitle investors to some of Dubai World's assets, H.H Sheikh Ahmed bin Saeed Al-Maktoum, Chairman of the Supreme Fiscal Committee, has already issued a statement confirming the Dubai Government's intention to directly intervene and manage the restructuring of Dubai World commercial operations and its debt obligations. Although some people are afraid that this could turn into an Argentina style debt default or a repeat of volatility of Q4 2008, what is more worrisome is the fact that this may be indicative of the health of the entire property sector in the Middle East. Which global banks are deeply exposed there?

STOCKS

Analysis: Apart From Dubai, Pullback Potential Was Already Present & Watch for Black Friday Results

Even before Dubai threatened markets with the largest sovereign credit default since Argentina in 2001, a larger underlying shift in global capital markets likely already began in October. In addition to Dubai, consider the already extant pressures on risk appetite.

  • Morgan Stanley index of world stock prices fell the most in eight months while
  • The VIX Index, a stand-by measure of investors’ fear, rose the most in a year.
  • The S&P 500 remains unable to sustain a break above multi-week resistance at 1100, and any failure by world leaders to calm markets soon will harden that resistance.
  • The financial system's resistance to further crises has been weakened by the crisis of the past two years, with central banks already burdened with debt. Relative equity valuations have looked excessive for some time now with prices trading at the highest levels relative to earnings in seven years.
  • Further, the market’s mood seems to be in transition, with the relief that collapse had been averted, which produced the risk rally of recent months, giving way to concerns about valuations and what happens when interest rates invariably reverse course higher and the flow of government cash dries up.
  • Companies’ “better than expected” earnings of the past several quarters have relied heavily on, cost cuts, usually from firing workers. Ultimately this means lost consumer demand.

Commodities

If the crisis appears to spread (and this could take time to play out, similar to the US subprime crisis), most will drop back. This includes gold, unless fear of another threatened global collapse occurs, which could favor gold.

Currencies

If the crisis lingers on, or markets pull back for some other reason (there are potentially many), the JPY, USD, and CHF will be the big likely winners. The AUD, NZD, CAD, and EUR would retreat against these.

DISCLOSURE: NO POSITIONS IN THE ABOVE

Global Markets Outlook 11/30 – 12/04 Short Version: Dubai, Other Key Events, Implications

NB: THE BELOW IS A HIGHLY ABRIDGED VERSION. THOSE SEEKING FULL DETAILS ON EACH SECTION SHOULD VISIT http://fxmarketanalysis.wordpress.com or http://worldmarketsguide.com

SPECIAL SECTION: The Threat of Dubai Debt Crisis Spreading Hangs Over All Global Asset Markets

Key Points to Note

The biggest near term influence on the direction of risk appetite and global markets appears likely to be the Dubai debt crisis, so we need to evaluate the importance of this past week’s credit scare.

The request to delay repayment on its loans by Nakheel (a real estate development arm of Dubai's development fund Dubai World) confronts markets with what is potentially the largest sovereign default since the 2001/2002 when Argentina stopped payments on its government bonds. The Dubai default threat does not have the same fundamental complexities as its Argentina's did, however, context and timing can be everything.

Given that markets are:

  • Sitting atop an extended rally on questionable fundamentals and valuations
  • Nervously remembering how two years ago, a supposedly containable US real estate default crisis metastasized into a near worldwide financial and economic collapse from which they are still trying to recover

a far more dramatic response from the dollar and nearly every other asset class is quite conceivable, thank you.

Market concerns include:
  • Rising risk aversion lowers the creditworthiness of related entities, particularly those that have lent to Dubai World. Most of those are either UAE-related or European banks. This isn’t a huge issue, unless it becomes a big European issue — unlikely, but note that European banks are even more levered than US banks. It's believed that UK's RBS, HSBC, Barclays, Lloyds and Stand Chartered are having large exposures in case of defaults. Who would be affected if these were undermined?
  • Secondary aftershocks to entities similar to Dubai — other places in the world that have borrowed a lot (Greece, Ireland, Iceland, parts of Eastern Europe, etc). Thus many emerging markets are getting hit in this mini-crisis by rising borrowing costs, which brings them closer to defaults of their own.
  • More borrowing to solve the Dubai crisis makes another one more likely.

o What investors should remember is that in ordinary circumstances (peace, absence of famine, plague, or rampant socialism), the economies tend to grow at about 2%/year. One can try to increase that by borrowing, and at the right opportunity that can be a winner. But most of the time, huge increases in debt levels are eventually associated with default. In a highly leveraged financial system where lenders are themselves indebted, defaults can cascade. As markets get more risk averse and credit tightens (i.e. rates rise to compensate for perceived increased risk) various government ministers/bureaucrats come forth and say, “There is nothing fundamentally wrong here. All we need is to restore confidence. This is not a solvency issue, it is a liquidity issue!” They answer by taking on more debt to free up liquidity.

o Risk that an isolated default can spread then rises, as an increasingly leveraged financial system comes more and more to resemble a massive arrangement of dominoes. The more leverage on any entity, the taller that domino. The more leverage in the system, the more tightly the dominoes are spaced. That arrangement collapses when someone knocks over a key domino.

In the week ahead, the key to gauging price action for the broader financial markets and the USD will lie with the market’s ultimate response to the Dubai crisis. There hasn't been enough time to see market’s true response to the threat. The incredible volatility through the end of last week was certainly leveraged by the thin liquidity from the US holiday.

Indeed, the timing of Dubai World's announcement coincidentally (?) allowed an incredible short term profit opportunity for anyone with advanced notice, and to minimize the time markets had for panicking before taking a weekend break to calm down and perhaps minimize the chances of an even more extreme reaction. Liquidity was extremely low at the time of the Nov 25th-26th announcement, with both the US and Islamic World their respective Thanksgiving and Eid holidays. Thus the volatility generated by this market moving news was exaggerated by the small number of traders available.

The demand for safe-haven dollar shorts unwound was so strong that the euro hit an intraday low of 1.4829 when the European markets opened. The price action in USD/JPY tells us that risk aversion was the primary driver of the forex markets as USD/JPY dropped to a 14 year low when the Asian markets opened last night.

Ray Of Hope From Friday's End of Session Action?

Perhaps very significantly for the coming week, the selling did not continue into the U.S. trading session. The limited number of U.S. traders Friday actually sold rather than bought dollars which suggests that not everyone believes that the Dubai news will have immediate global ramifications, because the first reaction to a major surprise announcement like this one is always sell first and ask questions later. As a result, the USD and JPY were the biggest winners. That USD buying didn't continue into Friday suggests markets might open Monday on a more positive note.

Indeed, when the deep pockets return to the market after having had a weekend evaluate things, it will be easier to establish true trends as there will be a source for momentum.

While we can't say for certain whether this is the beginning of a longer term reversal in risk assets, some tentative conclusions can be drawn.

Additional Points to Consider

As noted above, a major surprise risk event like the Dubai news is one of the few things that might set a near term bottom in the U.S. dollar as its safe haven status overrides its still poor fundamentals.

Investors fear that this could mean an outright default on Nakheel's debt, because delinquency is usually the precursor default.

While U.S. and European banks have very small exposure to Nakheel’s debt, it's not fully clear who has what exposure, and how well they can absorb possible losses. Many believe the crisis is quite containable

However, markets heard the same kind of talk at the start of the US sub-prime lending crisis, and realize that these things can quickly snowball into far bigger problems.

Granted a default may entitle investors to some of Dubai World's assets, H.H Sheikh Ahmed bin Saeed Al-Maktoum, Chairman of the Supreme Fiscal Committee, has already issued a statement confirming the Dubai Government's intention to directly intervene and manage the restructuring of Dubai World commercial operations and its debt obligations. Although some people are afraid that this could turn into an Argentina style debt default or a repeat of volatility of Q4 2008, what is more worrisome is the fact that this may be indicative of the health of the entire property sector in the Middle East. Which global banks are deeply exposed there?

STOCKS

Analysis: Apart From Dubai, Pullback Potential Was Already Present & Watch for Black Friday Results

Even before Dubai threatened markets with the largest sovereign credit default since Argentina in 2001, a larger underlying shift in global capital markets likely already began in October. In addition to Dubai, consider the already extant pressures on risk appetite.

  • Morgan Stanley index of world stock prices fell the most in eight months while
  • The VIX Index, a stand-by measure of investors’ fear, rose the most in a year.
  • The S&P 500 remains unable to sustain a break above multi-week resistance at 1100, and any failure by world leaders to calm markets soon will harden that resistance.
  • The financial system's resistance to further crises has been weakened by the crisis of the past two years, with central banks already burdened with debt. Relative equity valuations have looked excessive for some time now with prices trading at the highest levels relative to earnings in seven years.
  • Further, the market’s mood seems to be in transition, with the relief that collapse had been averted, which produced the risk rally of recent months, giving way to concerns about valuations and what happens when interest rates invariably reverse course higher and the flow of government cash dries up.
  • Companies’ “better than expected” earnings of the past several quarters have relied heavily on, cost cuts, usually from firing workers. Ultimately this means lost consumer demand.

Black Friday Results Due Early This Week

In addition to the reverberations from Dubai, another critical event played out on Friday- Black Friday, named because it's the official opening of the US holiday gift buying season that essentially extends until after the New Year. Results should be out early this week and give some hint at how this make-or-break period for retailers plays out. A bad season could mean more layoffs and commercial loan defaults from the retail sector.

Weekly Recap Nov. 23-7

A surprising sell-off in overseas markets triggered by Dubai debt concerns led to sharp losses in U.S. equity markets on Friday, wiping out the gains made earlier in the week.
The market's only notable move higher this week came at the open on Monday, when a weaker U.S. dollar and much better-than-expected Existing Home Sales report helped stocks surge. 

Stocks held those gains through Monday's session, and into Tuesday and Wednesday as volume slowed ahead of the Thanksgiving Day holiday.  But one headline from Wednesday, that the UAE government was restructuring Dubai World, didn't initially receive much of a reaction.
But on Thursday, with U.S. markets closed, European markets plunged as concerns grew, helping to change investors' risk appetite.  The Dubai government asked creditors, which reportedly include many European banks, particularly in the United Kingdom, to defer payments on some $20 billion in debt coming due over the next 18 months.
Asian markets, which had traded lower on Thursday, plunged overnight on Friday, and the weakness carried over to U.S. markets, with the S&P 500 losing 1.7%. 
Even if Dubai crisis is contained, it may still serve as warning for those seeking to book profits ahead of yearend tax selling to do so soon.

MAJOR COMMODITIES

Commodities dropped sharply around the world along with risk sentiment from fear of contagion effect from Dubai debt payment delay request, which could trigger second wave in the credit crisis. Gold has a better chance of stabilizing and recovering if Dubai crisis is contained, because it has shown it can rise while the other markets struggle. Oil to follow stocks, then fundamentals. Both of these bearish for now.

CURRENCIES

USD

On Temporary "Dubai High" or Reversing Trend?

Summary

US Dollar Outlook: Bullish

- Key Events: Monday: Preliminary Black Friday Sales Results, Tuesday ISM Manufacturing PMI, Pending Home Sales m/m, Construction Spending m/m, Wed. Fed Beige Book, Thurs. ISM Non-Mfg. PMI, Fri. Non-Farms Payrolls, Unemployment Rate

- Fear of Dubai debt default contagion reminds traders of the dollar’s value

- US recovery more measured than initially expected, confidence uncertain

- Is the USD's recent bounce the start of a true technical reversal?

EUR

Critical ECB Decision, US NFP Bring EUR Volatility -Euro Drops on Dubai World Credit Scare

Summary

EUR Outlook: Bearish/Neutral – Moving Opposite USD

- Key Events: Mon. Eurozone (EZ)CPI y/y, Tues. German Unemployment Change, Rate, EZ Unemployment Rate, Wed. EZ PPI m/m, Thurs. EZ GDP q/q, Retail Sales m/m, ECB Interest Rates

- Bargain-hunters still maintain Euro bid through week’s end, suggest EUR resilience or USD weakness in the face of all but most dire crises, suggesting EUR/USD downtrend tough to break barring real pullback in stocks.

- ECB Decision to reduce QE could boost EUR, but could be outweighed by big moves in stocks

- EURUSD double top still forming?

GBP

Diminishing Risk Appetite To Support the Pound?

Summary

GBP Outlook: Bearish

- Key Events: Sun. Gfk Consumer Confidence, Hometrack Housing m/m Mon. Net Consumer Credit, Mtg Approvals, Tues. Nationwide House Prices, PMI Mfg., Thurs. PMI Services

- The second reading of U.K. 3Q GDP was revised higher to 0.3% from 0.4%, as Private consumption improved, but still shows UK in recession

- The BBA reported that loans for house purchase rose to 42,238 from 42,073, highest in over a year

- The CBI Quarterly Distributive trades reading improved to 13 from 8

- Lies in the middle of risk appetite spectrum, will move with risk appetite, USD

JPY

Probable Drop In Risk Appetite & Improving Fundamentals Likely to Outweigh BoJ Intervention Threats

Summary

Yen Outlook: Bullish

- Key Events: Mfg. PMI, Industrial Production y/y, Mon. Housing Starts, BoJ. Gov. Speaks

- Trade Surplus Swells as Unemployment Weighs on Imports

- BOJ May Resume Buying Corporate Debt, Meeting Minutes Show, to weaken the yen

- Jobless Rate Declines For the Third Month as Workers Exit Labor Force

- Officials Step Up Currency Intervention Threats as Yen Pushes Higher

- The key to restoring yen weakness lies with stabilizing risk appetite than with the BoJ

- BoJ should consider US examples of how to weaken a currency via stimulus increase

CHF

Moving With Risk Appetite, And That's Good For the CHF

Summary

CHF Outlook: Bullish/Neutral

- Key Events: Mon. SNB Chairman Roth Speaks, Tues. SVME PMI, Friday CPI m/m

- Safe Haven Status Helps in Dubai Scare

- SNB intervention looms if big pullback in risk assets pushes CHF higher against the EUR

- Gaining against USD, EUR

CAD

CURRENT ACCOUNT DEFICIT HITS RECORD HIGH-Likely to Continue Following Oil, Stocks, News In That Order.

Summary

CAD Outlook: Bearish

- Key Events: Mon. GDP m/m, Fri. Unemployment Change, Rate, Ivey PMI

- Losing ground to the USD since mid October, trend could continue

AUD

Riding Risk Appetite Down, But Could Be Least Hurt Of All The Risk Currencies

Summary

AUD Outlook: Bearish

- Key Events: Tues. Building Approvals, Cash Rate, RBA st., Thurs. Retail Sales m/m

- Moving with Risk Appetite, But May Drop Least if Markets Pull Back

NZD

Moving With Risk Appetite And Thus Vulnerable to Pullback

Summary

NZD Outlook: Bearish

- Key Events: Mon. Building Consent

- Like the CAD, has risen with the AUD yet lacks the fundamentals to justify the rise

- Little major NZD news means it will go with risk appetite, which is likely to be flat to down

- Down trending against the USD since early Nov

CONCLUSIONS

The beginning of the week will be dominated by further reactions and news related to Dubai, we expect some attempts to calm markets from Dubai and other world leaders. Black Friday results may also figure strongly. After that ECB announcements about reducing QE and events leading up to and including US employment reports Friday should be the dominant market movers.

Traders should keep watch on these events and as always, on the major stock indices, especially the S&P 500.

DISCLOSURE – NO POSITIONS IN ABOVE MENTIONED INSTRUMENTS

Thursday, November 26, 2009

The Must-Know Truth About Stocks and the USD

Want a solid grasp of inter-market relationships in 10 seconds? Here it is:


Just follow the S&P 500 Chart, in whatever time frame you trade or invest.


A Brief Explanation & Executive Summary of this Article

In general:

• Most asset markets follow the moves of global stocks, either moving in the same or opposite direction, but deriving that direction from global equities. That's because equities are the best overall picture of global risk appetite (so much so that the movements of global stocks and risk appetite are virtually one and the same)

• The S&P 500, as the most representative index of the US stock market, still the world's single largest stock market, is the one chart that best summarizes the prevailing sentiment, be it positive (aka risk appetite or optimism) or negative (aka risk aversion or pessimism).

• In general, in the short term the S&P 500 also drives the direction of currency value, especially that of the most liquid one of all, the USD. In sum, it is truly the One Chart to Rule Them All (yes, yes, of course there are exceptions, qualifications etc. Please, I'm trying to keep this simple for the lay-traders).

• Many commentators wrongly believe the opposite, that a weak USD drives stocks higher, due to cheaper US exports and inflated US multinational earnings from foreign revenues, and a strong dollar drags them lower. By the same logic underpinning this belief, European and Asian stocks should behave in the opposite manner, as a weak USD hurts their exports and earnings. In fact European and Asian stock markets move in the same direction as the S&P 500 relative to the USD. That is, when they rise, the USD falls, and vice versa. So what is the real relationship between the USD and stocks?

• Risk appetite/optimism about economic recovery and growth is best reflected in stocks. When there is optimism, i.e. rising stock markets, that causes traders to buy higher yielding currencies and sell/borrow the low yield USD (and a few others, but especially the USD) to fund these purchases at low interest, hoping to profit on the interest rate differential. In effect they are "shorting" the USD. When fear aka risk aversion rises, traders unwind these trades and buy back the USD, causing the USD to rise like a shorted stock. THUS STOCKS USUALLY DRIVE THE USD AND OTHER FOREX PAIRS, NOT VICE VERSA


The One Chart That Rules Them All Rules the USD Too-Though Many US Stock Commentators Don't Get It


In other words: Equities Generally Drive the USD and Other Currencies , Not Vice Versa.

Many US stock pundits still don't get it. Many believe the USD is a primary cause of movements in the S&P 500 and other major stock indexes.

For example, look at the US stock market summary of the November 25th US stock market action published on Yahoo! Finance from Briefing.com, which opened with the following statements.

A new 52-week low for the Dollar Index [emphasis mine] and a generally pleasing batch of economic data helped stocks make their way higher….


Renewed pressure against the U.S. dollar sent the Dollar Index to a 1.1% loss, its worst single-session percentage drop in nearly four months. The drop also put the Dollar Index at a fresh 12-month low, but gave a broad lift to the equity market.

In other words, a weak dollar lifts stocks, and vice versa. In general, the opposite is in fact the case, stocks drive the USD and other forex, not the other way around.

This confusion is somewhat understandable if one considers the perspective US based, US-centric stock commentators who don't fully do their homework. Why?

What Confuses Many US Stock Pundits


• If one focuses ONLY on US stock market movements and USD movements during US stock market hours, the negative correlation (tendency to move in opposite directions) occurs simultaneously, so the real cause/effect relationship isn't clear on a superficial level.

• Forex Does Affect Equities Over the Longer Term: It's true that forex does affect equity markets, however this influence is usually over the longer term. One reason for this is that longer term forex trends influence interest rates over a longer term, which in turn influences demand for equities. Conversely, stock market movements tend to have immediate impact on currency markets. Much of the reason for this is that 80% of currency trading is speculative, mostly very short term from minutes to a few days. A much larger proportion of equities tend to be held for longer periods.

There ARE reasons a weak USD might move stocks in the short term. This reasoning is seductively simple:

• A rising dollar makes US exports more expensive and less competitive, lowering earnings expectations. This is correct. Forget for a moment that it makes US imports, and America IS a net importer, cheaper and key imported imputs like oil cheaper, at least in theory.

• A rising dollar makes US multi-national earnings in foreign currency worth less, thus also lowering earnings expectations. This is also correct. Again, suspend any thoughts that a stronger dollar makes foreign currency denominated expenses cheaper.

While we're being easy on poor stock market pundits, please also put aside any thoughts about the potentially disastrous effects of a long term decline in the US dollar on the US economy (and US corporate earnings, because 70% of US GDP is domestic consumer spending), how it will ultimately drive up the interest rates that the US government must pay to finance itself, interest rates in general (goodbye housing market, bank credit risk, banks, housing related jobs, etc), and the effects of the dollar ultimately losing its reserve currency status (far less demand still for the USD). What the heck.


WHY THE ABOVE REASONING IS WRONG

However, if a weak dollar is good for US stocks for the above reasons, it should be bad for Asian and European stocks for the same reasons. That is:

• A weak US dollar makes exports from these regions more expensive and less competitive, and should thus lower earnings expectations seriously. The US is still one of, if not the, largest customers for these regions.

• A weak US dollar makes the dollar denominated earnings from sales in the US, (again, often the biggest single customer they have) from these exports worth less, again lowering earnings expectations. In the case of commodity exporters, this is an especially serious problem unless commodity prices rise (and they don't do so easily when the growth picture gets negative and stocks fall) because their commodities are typically priced in dollars.


Thus by the same reasoning that says a weak dollar is good for US stocks and a strong dollar is bad for them, then Asian and European stocks should be falling when the US dollar falls and rising when it rises. In other words, they should correlate positively with the USD. Rising when the USD rises, and falling when it falls.

Indeed, the positive effects of a weak USD should be more pronounced, because most economies in Asia and many Europe depend on exports for a far larger portion of their GDP than the US, which derives most of its GDP from domestic consumer spending.

As an analyst who lives seven hours ahead of EST, and watches all major global stock, forex, and commodity markets, especially during the hours in which Asian and European equities markets are open, I see things many miss.

Here's a key observation that anyone in the markets must understand:

In fact, major Asian and European stock markets share the same multi-day (and longer) trends that US stocks show, moving in the opposite direction of the USD. That is, when Asian and European stocks are rising, the USD is falling, just like is does with US stocks.

That all global stocks in general are rising while the USD falls suggests that the reasoning behind the "dollar as a major mover of stocks" is wrong, because a weak USD should be hurting non-US stock markets by the same reasoning used by those who claim it helps US stock markets.


THE USD HAS BEEN IN A DOWN TREND SINCE MARCH 2009


Let's examine the below charts and how the USD and Global Stocks have moved over the same periods.

Here’s a chart of the UUP, an ETF that rises with a rising USD and falls with a falling USD


UUP Daily Chart : Note how it's been falling since the March Rally in Global Equities Began (08 Nov 25)

Note how the USD has been falling since early March, the same time that Global stocks began rallying.

For another example of the USD's fortunes, here's a daily chart over the same period of the EURUSD, perhaps the forex trading pair most representative of the USD's fortunes, because this pair alone comprises about one third of all forex trades. Thus every third forex trade is this pair, and for every 3 Euros bought or sold, a USD is used, and vice versa.

Here too, note how the EUR has gained over the USD, meaning the USD has been weakening during this period against other pairs. Check any major forex pair you want, the trend is indeed the same – weakening USD.


EURUSD Daily Chart 3/09—11/09 (06 Nov 26)  Chart Courtesy of AVAFX.com

Thus for those not aware of it, since March, the USD has been losing value and in a steady down trend against other major currencies.

EXAMPLES OF INTERNATIONAL STOCK MARKETS RISING WHILE THE USD FALLS

Meanwhile, not only has the S&P has been in a strong uptrend, but so have most other major international stock indexes.

European Stock Indexes

For example, look at a daily chart of the DAX, the main German stock market index.


Daily Chart DAX 3/09—11/09 (07 Nov 26)    Chart Courtesy of AVAFX.com


Here's a daily chart for the CAC, the main French stock index


Daily Chart CAC 3/09—11/09 ( 08 Nov 26)     Chart Courtesy of AVAFX.com


Here's a chart for the FTSE, the main UK stock index


Daily Chart FTSE 3/09—11/09 (09 Nov 26)      Chart Courtesy of AVAFX.com

Note how all have similar up trends to that of the S&P 500


Asian Stock Indexes

The same trends have held for the Asian markets, for example this chart of Hong Kong's Hang Seng. Considering the negative effects of a weak dollar on Chinese export earnings, this chart should not be showing such a strong uptrend if in fact the reasoning applied by US stock pundits held true. If the dollar was driving stocks, this and other charts of Asian export economies should be more of a mirror image of the S&P 500 rather than a similar and sometimes more strongly up-trending version


Daily Chart Hang Seng Index 3/09—11/09 (10 Nov 26)


THE TRUE RELATIONSHIP REVEALED - WHY STOCKS IN FACT USUALLY PROVIDE DIRECTION THE USD AND FOREX TRADE IN GENERAL

When Asset Markets Are Optimistic, Currency Traders Sell Dollars

Global stocks, arguably best represented by the S&P 500, are widely believed to be the best barometer of optimism about growth prospects, aka risk appetite, or pessimism, aka risk aversion.

When there is risk appetite, traders buy currencies that tend to rise when there is growth (for a variety of reasons, but mostly because these offer the highest short term yields). These are referred to as risk currencies, because they tend to rise with risk appetite. The main ones being the AUD, NZD, EUR, and CAD).

When Stocks Markets Retreat, Currency Traders Buy Back Dollars (also JPY and CHF), Thus Misleadingly Labeling these "Safe-Haven" Currencies

When there is fear or risk aversion, the risk currencies are sold and traders buy back the low yielding currencies used to fund these purchases, thus these low yielders tend to rise in times of fear. Thus this group is known as the safe-haven currencies. The USD has, over the past few years, generally been the #2 most in-demand safe haven currency, after the #1 JPY, though recently it has arguably become #1 currency bought in times of fear.

These Labels Refer to Market Behavior Only, Not Fundamental Store of Value Safety

Understand that these labels do NOT at all mean that one currency is actually a better or less reliable store of value than another, indeed some of the "risk" currencies have much better fundamentals than the safe havens, and are backed by far healthier banking systems that are largely unburdened with bad debt, unlike the USD.

Rather this nomenclature simply refers to how the currencies behave in times of optimism of pessimism.

Because risk and safety assets tend to move in opposite directions at the same, which asset influences which is not always clear to casual observers. To further complicate matters the roles do at times briefly shift, and the primary forces that drive a given currency price can and do change over time.


Conclusion: Short Term Movements In Stocks Drive Daily Currency Movements , Whereas Currencies Generally Influence Stocks Over a Longer Period

Short term currency moves thus generally have little short term influence on stocks, whereas short term stock market movements have immediate influence on currency pair prices.

This is true for all economies to varying degrees, though in fact ironically far less so for the USD, since most of US GDP is from consumer spending, NOT exports. As a net importer, when the US economy is healthy and importing, the US economy reaps benefits, especially in the short term, from a strong USD because the imports become cheaper.

However, about 80% of currency trade is from very short term speculative traders, and in the short run, they look to the direction of stocks to decide whether to go long or short on the risk currencies or safety currencies.

The above article has attempted to present a complex topic in simple terms, and thus inherently suffers from certain oversimplifications. Historically, currencies trade based on the same fundamentals that influence their local stock markets, and thus have often move in the same direction.

That has not been the case since the current crisis began. Until there are deep improvements in the fundamentals of the US economy that will allow the Fed to raise interest rates, the USD is likely to continue to move in the opposite direction of stocks, as are other low yielding currencies like the JPY and CHF (the CAD has fundamental underlying differences from these that allow it to trade in the same direction as risk appetite / stocks despite its low yield).


Since the current downturn began, the USD started trading as a safe-haven currency, i.e. one that traders buy ONLY in times of rising fear. Without getting too much into the technicalities of why this is the case (like that it's used as a funding currency of carry trades) suffice to say that it behaves this way due to the USD's poor fundamentals, including:

• Low income: yield low short term yields that are likely to be among the last among the major currencies to rise, thus one gets very low returns from holding low risk USD debt

• Low chance of capital gains due to (at least perceived) ballooning supply that is widely believed to virtually guarantee inflation/devaluation), thus making the USD a poor holding for capital appreciation


Thus the only reason to hold the USD at this time is that it DOES tend to rise when there is risk aversion. Because stocks are currently seen by currency traders as the prime barometer of risk appetite, the safe-haven USD falls when stocks rise and vice versa when they come in.


DISCLOSURE: NO POSITIONS IN ABOVE INSTRUMENTS

Tuesday, November 24, 2009

BEST INTERNATIONALTRADES PER DAILY CHARTS 11/24: S&P 500 Stalled at Resistance, Ditto Other Risk Assets

S&P 500: Resistance holding at 1110 where there is a convergence of both the upper Bollinger Band and a bearish doji candlestick from Nov. 18th, surrounded by equally indecisive spinning top candlesticks. Also of concern, the price level is currently in the middle of its rising channel, and the current $1100 level is itself a price resistance level. Thus we believe traders should be wary of opening new positions on this index and on all other assets until we get a decisive move above or below 1100. As noted above, it’s a struggle between liquidity pushing stocks up vs. concerns over the underlying fundamentals and high valuations that suggest selling. Unclear how it will play out. Because the S&P 500 is so representative of overall risk sentiment, and thus the "One Chart to Rule Them All", this indecisive picture suggest traders should make long or short moves when the S&P hits support levels at 1076 (Fib retracement +20 day MA + some price support from mid-October + rising trend line) or a decisive break over 1100. Traders should be very cautious opening long positions in risk assets at this time, and employ tight trailing stops or monitor positions closely on existing open long risk asset positions.


S&P 500 Daily Chart as of Nov 24 (01 Nov 24)


GOLD: Continues moving largely independent of movements in equities, moving instead on speculation (or a new fundamental outlook of greater demand?) that other central banks and other large buyers may do the same, and breaking to new highs despite the struggles of stocks and energy commodities with which it has typically moved. The below chart shows possible retracement points if/when the move makes normal retest of support. Making a very grudging retreat, far less than most other risk assets, in early Tuesday trade


NB: Yesterday's candle shows an indecisive spinning top. No major deal by itself, but taken together with

• it's being perched atop such a steep, fast rally and

• the coming a low liquidity thanksgiving weekend


Traders have to be wondering if the next day or so might be a time to book profits. Those with open longs should have some kind of stop loss to protect profits.


Gold Daily Chart (02 Nov 24)


As noted in our Global Markets Outlook 11/23-11/27:


Last week, gold rallied +2.75 to 1146.8 and the new record high was set Wednesday at 1153.4.


There's a growing belief in a new fundamental factor -- that underlying demand for gold has increased due to central bank buying. After the Reserve Bank of India, the Bank of Mauritius bought 2 metric tons of gold from the IMF at market price on November 11. Compared with India's 200 metric tons, Mauritius' purchase was insignificant. However, same as the deal with India, the implications radiate far beyond the size of the deal itself.


Earlier this year, the IMF announced its plan to sell a total of 403.3 metric tons of gold to bolster its finances. The news weighed on market sentiment as investors worried about at how much and to whom the gold would be sold. Now, more than half of the planned amount has been sold to official sectors at market prices, sentiment appears to have shifted from concern over overhanging supply to disappearing supply as large exporter central banks and sovereign wealth funds seek to convert depreciating dollar holdings into gold. Right or wrong, that is the sentiment at this time, and it's been strong enough to send gold soaring while crude and stocks have been stalling out. Impressive relative strength that has won many believers and convinced markets that any pullback will not be pronounced or long.


Consider:

• In April, China, the biggest gold producer in the world, increased reserves by +76% to 154 metric tons since 2003. The market anticipates China will be another big buyer of IMF's gold.

• Since the beginning of 2009, gold price has rallied almost +30%. Also, after breaching 2008-high at 1033.9, the yellow metal's rise has accelerated, jumping more than 100 dollars in a month. The long-term uptrend is not likely to end soon.

• Apart from government buying, new private gold funds should give a further boost to robust investment demands. John Paulson announced his plan to launch a new gold fund next year with as much as $250M of his money. Large gold ETFs or funds usually have holdings that are comparable to central banks. For instance, SPDR Gold Shares, the world's largest gold ETF, is the world's 5th largest bullion owner just below France and above China.


In short, it's not just increasing gold demand, but demand from big buyers.


In coming weeks, gold price should continue to be very much directed by USD's movement. However, the inverse relationship between gold and the dollar should not be taken for granted. For instance, in the 90s, the yellow metal's supply was so abundant that its price plummeted. In 2005, gold price surged due to tightness in the market. Therefore, some analysts hold that gold price may continue to rise given the reduction in gold production and increase in central bank demand, despite a possible rebound in USD early next year. Famed NYU Economics Professor Nuriel Roubini, credited for calling the current crisis years ago, believes the run in gold is an unsustainable bubble, while famed commodity trader Jim Rodgers holds gold is going much higher. As long as the central bank/sovereign wealth/momentum story holds up, Rogers looks correct.


Crude Oil: Following stocks lower early Tuesday. Range trading between $82-$76/bbl since mid October, moving more or less with stocks as the S&P struggles at the $1100 resistance level and oil at $82, neither to move higher until further positive news on the recovery. However, with gold having continued higher in utter disconnect from stocks and oil, the historic gold ratio now justifies oil as high as around $97.25 (12:1 ratio) and no less than $77.80 (15:1). Thus while crude remains range bound, if gold can continue breaking to new highs, as many expect it to do, then crude could follow it sharply higher over time, especially if other risk assets can avoid a sharp correction (which they are doing nicely, as shown by the S&P 500 breaching resistance at $1100) or there is evidence of continued strong demand from China and other developing economies.


NB: Crude has been among the weaker risk assets over the past month despite the USD's weakness. Crude peaked weeks before stocks did, and is behaving relatively worse than stocks. For example, yesterday's action showed that stocks were still able to retain some of their gains when momentum reversed, but crude could not, and closed lower. Not surprising, since crude tends to exaggerate the S&P 500's trends for better and for worse. Range bound for the near term, will likely follow stocks higher to its upper range near $82 if stocks can rally, but poor fundamentals and an extended rally for both oil and the S&P 500 that it tracks suggest more downside risk at this time.

Certainly seems unwise to consider new longs until oil hits at least the $73-6 range, if not lower. Watch the S&P 500 to lead oil.


WTI Crude Oil Daily Chart (03 Nov 24)


EURUSD: Like the S&P 500 and Oil, has been range trading since mid October and is closely mimicking the S&P 500's action yesterday and early Tuesday as of this writing. Expect it to continue to do so. It's primary advantage as a trading vehicle over the S&P 500 is that as a forex pair, traders can use 200:1 leverage, thus increasing profit potential dramatically, as a 1% move becomes a 200% change in profit or loss, thus making it an excellent vehicle for those with familiar with technical analysis and risk management tools, and the discipline to follow them. These aren't hard to acquire, and forex sites like avafx.com provide plenty of free material on the topic. For all others, forex is a great way to lose money really fast.


EURUSD DAILY CHART (04 Nov 24)


As noted in our Global Outlook for 11/23-11/27:


For the coming weeks euro traders need to consider the following developments.

• In the background, stimulus reduction that is starting to build momentum, developing both interest rate expectations and concerns that the Euro-zone economy will falter as government spending slows and exposes a weaker economy.

• Of more immediate concern, there's a series of weighty economic indicators that will offer some volatility.

• However, the main threat of an impending break in recent trends comes from intangible fundamental dynamics like liquidity and the influence of a domineering US dollar.


Risk appetite is the main catalyst and fuel for the financial markets. After an eight-month trend founded based on the need to reinvest funds and take advantage of an historical rally; confidence may now be turning into a hesitation that will be well reflected in the EURUSD.

While the overall rising trend of higher lows from March remains; the past few weeks have turned to chop that is starting to develop an ominous bias, similar to that of the S&P 500. Given the unusual market conditions that back this liquid pair up, the possibility of a reversal in trend shift is more pronounced. The US markets, the single largest source of liquidity in the world, begin an extended holiday weekend starting Thursday, and in turn, a full-week of notable economic releases gets condensed into just a few days. A combination of event risk and shallow market depth may be the final ingredients for a breakout.


NZDUSD: More room to short?


NZDUSD Daily Chart (05 Nov 24)


As Monday and Tuesday morning action shows, this pair is also mimicking stocks, like the EURUSD. Still has room to run in either direction within Fibonacci, Bollinger Bands, moving average and price level support/resistance levels.


We noted in our prior Weekly Outlook of 11/16 – 11/20 that this pair was likely to be one of the best shorting plays when stocks dropped back to retest support, because the pair had risen in tandem with the AUDUSD but the NZD lacked the strong underlying economic fundamentals of the AUD and was thus a better shorting candidate. Almost on cue, the pair fell about 282 basis points, 3.76%, a potentially almost 800% profit for currency traders typically using 200:1 leverage, of which they could easily net over 400% even if using a relatively conservative trading plan to minimize risk and get in only once a trend is established. Now in the middle of its $0.7562 - $0.7073 range since late October, the pair moves with the S&P, and this range has enough room to be played in either direction WHEN the S&P 500 decisively breaks though $1100 or drops to retest support


NB: See a daily chart of the AUDUSD, and note the similarity. Those seeking to trade this pair could apply the above mentioned indicators and comments.


GBPUSD: Another risk appetite play, especially as short opportunity if stocks continue to pull back?


On Nov. 9th, we wrote: "One of the strongest currencies last week against the USD and EUR as it gained on less than expected expansion of QE, but nearing the top of its trading range since mid July and at the top of its Bollinger Band Range and recent high of $1.700. Could be a good short trade if markets pull back." Like the NZDUSD above, has room to run in either direction if a trend resumes


GBP/USD Daily Chart. (05 Nov 09)


Look what happened.


GBP/USD Daily Chart (08 Nov 23)


The GBP/USD did just that the following week on evidence of new dovishness from the BOE and made a nice 2% move down, a potentially 400% profit for currency traders typically using 200:1 leverage, of which one could take a 200%+ profit if using a sound trading plan that minimizes risks by triggering entries only on confirmed trends and uses trailing stop losses to lock in gains. As the chart above shows, it's following the S&P 500 and has room to play in either direction once the S&P trend is clear. The pair also has enough support/resistance points to provide entry points for long or short plays if the S&P settles into a range for a while. The 1.6300, 1.6400, 1.6500 and 1.6800 levels provide both Fibonacci and price support/resistance.


Given the broken trend line, slight bias to the downside, though again, this pair should continue to follow the S&P 500.


DISCLOSURE AND DISCLAIMER: OPINIONS EXPRESSED ARE NOT NECESSARILY THOSE OF AVAFX, AUTHOR HAS NO POSITIONS IN ABOVE INSTRUMENTS.

Monday, November 23, 2009

BEST INTERNATIONAL TRADE OPPORTUNITIES 11/23/09

S&P 500


S&P 500 Daily Chart (01 Nov 23)


Resistance holding at 1110 where there is a convergence of both the upper Bollinger Band and a bearish doji candlestick from Nov. 18th, surrounded by equally indecisive spinning top candlesticks. Also of concern, the price level is currently in the middle of its rising channel, and the current $1100 level is itself a price resistance level. Thus we believe traders should be wary of opening new positions on this index and on all other assets until we get a decisive move above or below 1100. As noted above, it’s a struggle between liquidity pushing stocks up vs. concerns over the underlying fundamentals and high valuations that suggest selling. Unclear how it will play out. Because the S&P 500 is so representative of overall risk sentiment, and thus the "One Chart to Rule Them All", this indecisive picture suggest traders should make long or short moves when the S&P hits support levels at 1076 (Fib retracement +20 day MA + some price support from mid-October + rising trend line) or a decisive break over 1100.


GOLD:


Gold Daily Chart (04 Nov 23)


Continues moving largely independent of movements in equities, moving instead on speculation (or a new fundamental outlook of greater demand?) that other central banks and other large buyers may do the same, and breaking to new highs despite the struggles of stocks and energy commodities with which it has typically moved. The below chart shows possible retracement points if/when the move makes normal retest of support


As noted in our Global Markets Outlook 11/23-11/27:


Last week, gold rallied +2.75 to 1146.8 and the new record high was set Wednesday at 1153.4.


There's a growing belief in a new fundamental factor -- that underlying demand for gold has increased due to central bank buying. After the Reserve Bank of India, the Bank of Mauritius bought 2 metric tons of gold from the IMF at market price on November 11. Compared with India's 200 metric tons, Mauritius' purchase was insignificant. However, same as the deal with India, the implications radiate far beyond the size of the deal itself.


Earlier this year, the IMF announced its plan to sell a total of 403.3 metric tons of gold to bolster its finances. The news weighed on market sentiment as investors worried about at how much and to whom the gold would be sold. Now, more than half of the planned amount has been sold to official sectors at market prices, sentiment appears to have shifted from concern over overhanging supply to disappearing supply as large exporter central banks and sovereign wealth funds seek to convert depreciating dollar holdings into gold. Right or wrong, that is the sentiment at this time, and it's been strong enough to send gold soaring while crude and stocks have been stalling out. Impressive relative strength that has won many believers and convinced markets that any pullback will not be pronounced or long.


Consider:


• In April, China, the biggest gold producer in the world, increased reserves by +76% to 154 metric tons since 2003. The market anticipates China will be another big buyer of IMF's gold.


• Since the beginning of 2009, gold price has rallied almost +30%. Also, after breaching 2008-high at 1033.9, the yellow metal's rise has accelerated, jumping more than 100 dollars in a month. The long-term uptrend is not likely to end soon.


• Apart from government buying, new private gold funds should give a further boost to robust investment demands. John Paulson announced his plan to launch a new gold fund next year with as much as $250M of his money. Large gold ETFs or funds usually have holdings that are comparable to central banks. For instance, SPDR Gold Shares, the world's largest gold ETF, is the world's 5th largest bullion owner just below France and above China.


In short, it's not just increasing gold demand, but demand from big buyers.


In coming weeks, gold price should continue to be very much directed by USD's movement. However, the inverse relationship between gold and the dollar should not be taken for granted. For instance, in the 90s, the yellow metal's supply was so abundant that its price plummeted. In 2005, gold price surged due to tightness in the market. Therefore, some analysts hold that gold price may continue to rise given the reduction in gold production and increase in central bank demand, despite a possible rebound in USD early next year. Famed NYU Economics Professor Nuriel Roubini, credited for calling the current crisis years ago, believes the run in gold is an unsustainable bubble, while famed commodity trader Jim Rodgers holds gold is going much higher. As long as the central bank/sovereign wealth/momentum story holds up, Rogers looks correct.


Crude Oil:


WTI Crude Oil Daily Chart (05 Nov 23)


Range trading between $82-$76/bbl since mid October, moving more or less with stocks as the S&P struggles at the $1100 resistance level and oil at $82, neither to move higher until further positive news on the recovery. However, with gold having continued higher in utter disconnect from stocks and oil, the historic gold ratio now justifies oil as high as around $97.25 (12:1 ratio) and no less than $77.80 (15:1). Thus while crude remains range bound, if gold can continue breaking to new highs, as many expect it to do, then crude could follow it sharply higher over time, especially if other risk assets can avoid a sharp correction (which they are doing nicely, as shown by the S&P 500 breaching resistance at $1100) or there is evidence of continued strong demand from China and other developing economies.


EURUSD: Like the S&P 500 and Oil, has been range trading since mid October and is likely to continue to follow the S&P 500.


EURUSD DAILY CHART (06 Nov 23)


As noted in our Global Outlook for 11/23-11/27:


For the coming weeks euro traders need to consider the following developments.


• In the background, stimulus reduction that is starting to build momentum, developing both interest rate expectations and concerns that the Euro-zone economy will falter as government spending slows and exposes a weaker economy.


• Of more immediate concern, there's a series of weighty economic indicators that will offer some volatility.


• However, the main threat of an impending break in recent trends comes from intangible fundamental dynamics like liquidity and the influence of a domineering US dollar.


Risk appetite is the main catalyst and fuel for the financial markets. After an eight-month trend founded based on the need to reinvest funds and take advantage of an historical rally; confidence may now be turning into a hesitation that will be well reflected in the EURUSD.


While the overall rising trend of higher lows from March remains; the past few weeks have turned to chop that is starting to develop an ominous bias, similar to that of the S&P 500. Given the unusual market conditions that back this liquid pair up, the possibility of a reversal in trend shift is more pronounced. The US markets, the single largest source of liquidity in the world, begin an extended holiday weekend starting Thursday, and in turn, a full-week of notable economic releases gets condensed into just a few days. A combination of event risk and shallow market depth may be the final ingredients for a breakout.


NZDUSD: New Shorting Opportunity?


NZDUSD Daily Chart (07 Nov 23)


We noted in our prior Weekly Outlook of 11/16 – 11/20 that this pair was likely to be one of the best shorting plays when stocks dropped back to retest support, because the pair had risen in tandem with the AUDUSD but the NZD lacked the strong underlying economic fundamentals of the AUD and was thus a better shorting candidate. Almost on cue, the pair fell about 282 basis points, 3.76%, a potentially almost 800% profit for currency traders typically using 200:1 leverage, of which they could easily net over 400% even if using a relatively conservative trading plan to minimize risk and get in only once a trend is established. Now in the middle of its $0.7562 - $0.7073 range since late October, the pair moves with the S&P, and this range has enough room to be played in either direction WHEN the S&P 500 decisively breaks though $1100 or drops to retest support


NB: See a daily chart of the AUDUSD, and note the similarity. Those seeking to trade this pair could apply the above mentioned indicators and comments.


GBPUSD: Another risk appetite play, especially as short opportunity if stocks continue to pull back?


GBP/USD Daily Chart. (05 Nov 09)


On Nov. 9th, we wrote: "One of the strongest currencies last week against the USD and EUR as it gained on less than expected expansion of QE, but nearing the top of its trading range since mid July and at the top of its Bollinger Band Range and recent high of $1.700. Could be a good short trade if markets pull back." Look what happened.


GBP/USD Daily Chart (08 Nov 23)


The GBP/USD did just that the following week on evidence of new dovishness from the BOE and made a nice 2% move down, a potentially 400% profit for currency traders typically using 200:1 leverage, of which one could take a 200%+ profit if using a sound trading plan that minimizes risks by triggering entries only on confirmed trends and uses trailing stop losses to lock in gains. As the chart above shows, it's following the S&P 500 and has room to play in either direction once the S&P trend is clear. The pair also has enough support/resistance points to provide entry points for long or short plays if the S&P settles into a range for a while. The 1.6300, 1.6400, 1.6500 and 1.6800 levels provide both Fibonacci and price support/resistance.


Given the broken trend line, slight bias to the downside, though again, this pair should continue to follow the S&P 500.


DISCLOSURE: NO POSTIONS IN THE ABOVE INSTRUMENTS

Sunday, November 22, 2009

WEEKLY GLOBAL MARKETS & FX OUTLOOK 11/23-27: Ominous Bearish Double Tops Still Forming on S&P 500, EUR/USD, Others

Because global stocks tend to lead global asset markets, and these markets are so tightly integrated, a weekly preview of major forex pairs and commodities demands that we first look at equities.

GLOBAL STOCK MARKETS-ONE CHART TO RULE THEM ALL

As always, we begin our weekly preview of global markets with a look at the S&P 500 stock index. International forex and commodity markets tend to move according to stocks, and no single index provides a better single picture of overall market sentiment than the bellwether S&P 500. Just note how similar most other major international stock or commodity daily charts are to that of the S&P 500 in both trend direction and magnitude of moves, although there can be short term deviations and at times even longer term exceptions, such as gold's current burst higher (more on that below).

That the S&P 500 is arguably the best single snapshot of global risk sentiment is not news to experienced traders, but for the benefit of all others, this idea can't be repeated enough – it's truly the One Chart To Rule Them All.

Here is a daily chart of the S&P 500 as of last Sunday.

clip_image002

S&P 500 Daily Chart With Volume With 10 Day Moving Average for Volume

04 Nov 15

We said:

the key points to note about the chart:

  • The possible formation of a bearish double-top pattern forming around the 1100 level
  • The relatively low volume on the rallies to this level compared to the much higher volume at the tops and on the pullbacks since the beginning of September until now. The red line on the volume histogram is a 10 day Simple Moving Average of Volume that clarifies how volume is relatively low on the rallies and higher on the pullbacks.

For perspective on the significance of the 1100 level, we zoom back to a weekly chart of the S&P 500 for the past 5 years. Note how this level has served as minor multi-week support resistance. Thus if the past is any guide, the rally will need to pass the 1100 within the next few weeks or risk losing credibility. If that happens, then risk assets are likely to either consolidate in a horizontal range or stage a long awaited normal pullback. Note that a drop of 100-300 points would be a perfectly normal retracement and markets would still be in a firm overall uptrend.

clip_image004

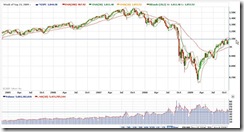
S&P 500 5 Year Weekly Chart with 10 Week Moving Average for Volume

06 Nov 15

Again, note the declining overall volume of the rally since April, suggesting a lack of believers in this rally. The bright side is that there may be a lot of cash still available to fuel further rally if the recovery becomes more convincing. The downside of this low volume rally is that it suggests they buyers were short term hot money that will be inclined to sell if the recovery falters. That in turn will depend on whether economies can begin to hold up without massive new stimulus, and if they can't, whether governments will be able to continue providing it, and for how much longer.

If one can answer those questions correctly, then they'll know whether to be long or short these markets and virtually every asset traded.

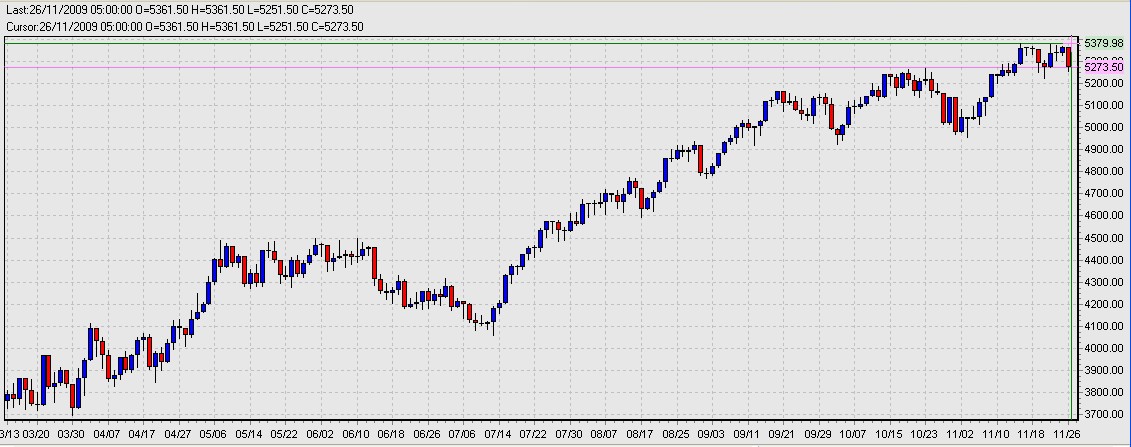
Here's the update chart as of 11/22, with the past week's trading marked off by the cursor highlighting Monday 11/16.

clip_image006

Daily Chart S&P 500 as of 11/22 (image 01 Nov 22)

Monday's gains were wiped out by a combination of end of week profit taking and signs that the ECB is beginning to end its stimulus and moving closer to raising interest rates. The key point to note is that after moving decisively higher Monday on decent volume, the market turned indecisive for two days and pulled back to close the week with a slight loss. The 1100 resistance level bent but didn't break.

Meaning? We're back where we were last week, both literally and figuratively – waiting to see if the markets are going to range trade or begin a more serious drop to test support. While another move higher can't be ruled out, the extent of the rally since March, it's questionable underlying fundamentals, and usual year end selling make for a clear flat to lower bias. Gold's meteoric rise over the past 3 weeks makes gold also vulnerable to at least some kind of support test which could push the USD higher and thus also weigh further on the S&P.

Do not be lulled into thinking that a Thanksgiving holiday induced low liquidity Wednesday-Friday means necessarily means quiet trading. As Kathy Lien pointed out recently, in fact, the third week in November is usually even more volatile than the average throughout the year. She notes:

Over the last five years, the average weekly volatility in currencies (measured by the difference between the weeks high and low) has been about 270 pips in EUR/USD. This figure jumps to 372 pips when examining the pound. However, the average volatility over the last five years on Thanksgiving week is more volatile at 340 pips in EUR/USD and 433 pips in GBP/USD. In fact, on only one occasion, in 2005, did holiday volatility fall below that of the overall average.

At first glance, these figures are pretty shocking, but it makes sense considering that Thanksgiving is only an American holiday. The loss in traders adds to the illiquidity of the market place, magnifying the severity of the moves. In addition, most funds are still trying to satisfy better than expected year end results, and might prefer to relax during Christmas rather than Thanksgiving. Looking at the week itself, volatility does dry up on Thanksgiving day, but is actually rather high on the day after. In any event, keep in mind that like seasonality studies these patterns do not hold 100% of the time. Just keep in mind that opportunities do not cease to exist just because it is a holiday week.

KEY COMMODITIES: Oil Slipping & Red Hot Gold

Commodity prices rose across the board with Reuters/Jefferies CRB Index gaining +2% last week. However, while precious metals and certain base metals continued with strong upward momentum, rallies in other commodities began to lose steam, most notably crude oil. We believe it's because investors' risk appetite is declining. If the above S&P chart wasn't enough evidence of growing risk aversion, and it usually is, recent macroeconomic data displayed a mixed picture on global economic conditions. In fact, the VIX, an index measuring the stock market's degree of fear, fell for the third consecutive week, by -5%, to 22.19 last week, indicating investors have become risk- averse.

Energy

Crude Oil

WTI crude oil fell after recovering to 78.61 Friday. The benchmark contract settled at 77.47, climbed +1.5% for the week. Despite the gain, price movements in recent weeks suggest that a temporary top was formed at 82 in mid-October. Look at the weekly chart, crude oil price rose and dropped on alternate weeks, with declines more than offsetting increases.

After breaking above the range of 65-75 in mid-October, crude oil appears to have formed a new trading range from $73 -- $82/bbl. Despite attempts to push price above 80, selling pressures appear to be quite strong there. Unless the S&P 500 moves higher we doubt there will be enough speculative bulls to push oil higher, and any move higher for now will be from shorter term traders. Supply/demand fundamentals show plenty of supply, arguably more than is being reported, for the near term.

OPEC members are satisfied with oil price at 75-78. Angolan oil minister even said that 80/bbl is 'not too high'. Some analysts have gone so far as to speculate that the Saudis are considering upping production and driving oil down in order to give Iran's economy and regime a not so gentle shove.

Hurricane Ida curtailed US imports and suspended operations of oil facilities. Therefore, declines in inventories were more than expected last week. Crude inventory drew -0.89 mmb to 336.8 mmb in the week ended November 13 as led by decline in the Gulf Coast as attack of Hurricane Ida suspended oil imports and productions. However, builds were seen in the East Coast, West Coast and the Midwest.

Natural Gas

Gas price movement continued to be volatile over the week. After rebounding +7.8% to 4.734 Tuesday from the low in the prior week, gas price tumbled to as low as 4.22 Thursday amid disappointing gas storage report. Price then bounced back again and closed at 4.424 Friday. On weekly basis, gas price added +0.7%.

Gas storage climbed +20 bcf to 3833 bcf in the week ended November 13. The increase slightly widened the difference from 5-year average to 12.3%.

Meteorologist forecast weather in coming weeks will still be warmer than historical average and this will be a bad news for natural gas demand which should remain threatened. We double gas storage will rise further in coming few weeks and this should continue to depress price.

Precious Metals – Has Demand Truly Increased?

Buying remained strong in gold and other precious metals. Last week, gold rallied +2.75 to 1146.8 and the new record high was set Wednesday at 1153.4.

There's a growing belief in a new fundamental factor -- that underlying demand for gold has increased due to central bank buying. After the Reserve Bank of India, the Bank of Mauritius bought 2 metric tons of gold from the IMF at market price on November 11. Compared with India's 200 metric tons, Mauritius' purchase was insignificant. However, same as the deal with India, the implications radiate far beyond the size of the deal itself.

Earlier this year, the IMF announced its plan to sell a total of 403.3 metric tons of gold to bolster its finances. The news weighed on market sentiment as investors worried about at how much and to whom the gold would be sold. Now, more than half of the planned amount has been sold to official sectors at market prices, sentiment appears to have shifted from concern over overhanging supply to disappearing supply as large exporter central banks and sovereign wealth funds seek to convert depreciating dollar holdings into gold. Right or wrong, that is the sentiment at this time, and it's been strong enough to send gold soaring while crude and stocks have been stalling out. Impressive relative strength that has won many believers and convinced markets that any pullback will not be pronounced or long. Consider:

  • In April, China, the biggest gold producer in the world, increased reserves by +76% to 154 metric tons since 2003. The market anticipates China will be another big buyer of IMF's gold.
  • Since the beginning of 2009, gold price has rallied almost +30%. Also, after breaching 2008-high at 1033.9, the yellow metal's rise has accelerated, jumping more than 100 dollars in a month. the long-term uptrend is not likely to end soon.
  • Apart from government buying, new private gold funds should give a further boost to robust investment demands. John Paulson announced his plan to launch a new gold fund next year with as much as $250M of his money. Large gold ETFs or funds usually have holdings that are comparable to central banks. For instance, SPDR Gold Shares, the world's largest gold ETF, is the world's 5th largest bullion owner just below France and above China.

In short, it's not just increasing gold demand, but demand from big buyers.

In coming weeks, gold price should continue to be very much directed by USD's movement. However, the inverse relationship between gold and the dollar should not be taken for granted. For instance, in the 90s, the yellow metal's supply was so abundant that its price plummeted. In 2005, gold price surged due to tightness in the market. Therefore, some analysts hold that gold price may continue to rise given the reduction in gold production and increase in central bank demand, despite a possible rebound in USD early next year.

CURRENCIES

USD

Range Trading Likely For the US Dollar

Summary

US Dollar: Bullish/Neutral

- Key Events: Monday-Existing Home Sales m/m, Tuesday-GDP q/q, Consumer Confidence, Personal Consumption, House Price Purchase Index q/q, Fed Minutes of Nov 3-4 Meeting, Wed. Personal Spending, Income, Durable Goods Orders, New Home Sales m/m

- Ben Bernanke calls for strong US Dollar, but Greenback fails to hold gains

- Crowd sentiment accurately calls for US Dollar bounce

- US Dollar surges as traders sell risk following Dell earnings report

Analysis

The US Dollar ended the week higher against all major currencies except the Japanese Yen, but failed to break key range highs against the Euro and other important counterparts. Forex markets remained highly indecisive and traders were seemingly unwilling to bust the Euro/US Dollar exchange rate from its multi-week range. Volatility is near its lowest levels of the year, and it seems FX Options traders are pricing in similar range trading for the holiday-shortened trading week ahead.

The indecision isn't surprising. As we've noted repeatedly, to achieve a sustained reversal, the USD will need either:

  1. A sustained period of at least consolidation if not reversal in global stocks and other risk assets that drives up demand for safe haven currencies as carry trades unwind. The S&P 500 has twice backed off from the 1100 level. Failure to break through soon could lead to at least a consolidation period if not outright reversal.
  2. A fundamental improvement in the US economy that brings recovery in the critical jobs, banking, and housing areas, quite possibly in that order, that provides reason for markets to believe USD interest rates will rise sooner than currently expected and thus lift the dollar out of its current status as a prime funding currency for carry trades.
  3. A selloff in the EUR, because for every 3 Euros bought, a USD is sold, thus any selloff on one automatically helps the other. Since March, this relationship has been a key driver of the EUR's rally.

The first possibility is the most likely, but as yet stocks have made only modest pullbacks, the second and third have not happened. In sum, there is still no major reason to buy dollars unless risk appetite turns into nausea and dollar shorts unwind.

Events

Although the North American Thanksgiving holiday means that markets will likely become illiquid through later-week trade, earlier-week price action could produce big US Dollar moves on several important reports, especially given the nervousness across key asset classes.

The first is the admittedly unpredictable Existing Home Sales report, which often goes unnoticed but occasionally produces great equity market volatility. The next day brings the second release for Q3 Gross Domestic Product figures, Conference Board Consumer Confidence survey results, and the minutes from the Federal Open Market Committee’s most recent policy meeting. All three events have been known to force considerable moves in the S&P 500 and US Dollar, and it remains important to watch for surprises from each.

Fed Chairman Ben Bernanke recently shook US Dollar markets when he said that the Fed was paying close attention to exchange rate moves. Markets will pay very close attention to any and all references to the US Dollar through the Fed’s discussions—especially because it trades near significant lows versus the Euro and other key counterparts. We doubt there will be any explicit mention of the US Dollar in the Fed minutes, but such low expectations could make for extensive volatility if in fact the Fed starts talking the dollar higher. Thus traders should be watching for post-Fed financial market price moves. Personal Income and Spending, Durable Goods Orders, and New Home Sales reports finish the week of significant US Dollar event risk. Any one of these releases could cause big moves—especially in the relatively illiquid trading session before the US holiday.

The US Dollar remains in a trading range against major counterparts, and very low volatility expectations suggest that it may remain restricted through the week ahead. We've often noted that extremely one-sided FX Futures and Options positioning meant that a substantive US Dollar correction was inevitable. We have indeed seen the dollar bounce off of range lows, but positioning has lately been correcting and does not necessarily point to further Dollar gains. This suggests that we may need to wait for a large shock across financial markets to force substantive shifts in trends. However low volatility expectations, as reflected in fx options, suggest further range trading for the coming week.

EUR

Euro To Breakout Against the Dollar This Week?

Summary

Euro Outlook: Bearish

- Key Events: Monday PMI Mfg, Services, Composite, Tuesday-Industrial Orders m/m, German GDP q/q, Wednesday German Gfk Consumer Confidence, Thursday-CPI y/y, Fri. Consumer Confidence

- European Central Bank takes another small step in unwinding stimulus by upping collateral standards

- The pace of Euro Zone inflation improves, but the annual figure is still contracting

- Are technical indicators leaning towards a EURUSD breakout that spurs reversal or trend continuation?

- EUR/USD likely to follow equities, but news could play a role if no major risk sentiment shifts.

Analysis

For the coming weeks euro traders need to consider the following developments.

  • In the background, stimulus reduction that is starting to build momentum, developing both interest rate expectations and concerns that the Euro-zone economy will falter as government spending slows and exposes a weaker economy.
  • Of more immediate concern, there's a series of weighty economic indicators that will offer some volatility.
  • However, the main threat of an impending break in recent trends comes from intangible fundamental dynamics like liquidity and the influence of a domineering US dollar.

Risk appetite is the main catalyst and fuel for the financial markets. After an eight-month trend founded based on the need to reinvest funds and take advantage of an historical rally; confidence may now be turning into a hesitation that will be well reflected in the EURUSD.

While the overall rising trend of higher lows from March remains; the past few weeks have turned to chop that is starting to develop an ominous bias, similar to that of the S&P 500. Given the unusual market conditions that back this liquid pair up, the possibility of a reversal in trend shift is more pronounced. The US markets, the single largest source of liquidity in the world, begin an extended holiday weekend starting Thursday, and in turn, a full-week of notable economic releases gets condensed into just a few days. A combination of event risk and shallow market depth may be the final ingredients for a breakout.

Events

The Euro event calendar is stocked with significant market-movers of its own. At the start of the week (before US liquidity drains), we get a complete take on sentiment and growth.

The German GfK consumer and IFO business confidence readings will define growth expectations into the months ahead. The former will be particularly important considering the German Finance Ministry recently suggested fourth quarter regional growth would slow from the strong third quarter showing owing to consumers’ efforts to retrench themselves as jobs and wages recede.

Perhaps the most significant, the second (final) reading of 3Q GDP will offer much needed detail on the health of the various sectors. It is important to weigh how much of the recovery is from German citizens, businesses, trade and government.

More timely data comes from the first measurements of the November PMI figures, which provide a good gauge for broader growth. After the US markets shut down early, euro traders will still have the noteworthy German CPI and Euro Zone confidence readings to consider.

The above mix of event risk and low late week liquidity leaves potential for volatility in general and thus certainly in the EURUSD, by itself about a third of all forex trade. It will likely reflect what we've said above about global stocks, so EURUSD traders must always be watching the bellwether S&P 500.

JPY

Yen Breakout Threatens in Thin, Risk-Driven Trade, Quiet Event Calendar

Summary

Yen Outlook: Bullish

- Key Events: Tues. Merchandise Trade Balance, BoJ Monthly Report, Wed.-BoJ Monthly Policy Meeting Minutes, Thurs.-Jobless Rate, Unemployment, CPI y/y

- Japan’s Economy Expanded Most in Over Two Years in Q3

- BOJ Keeps Rates Unchanged, Conflict with MOF Continues

- Growing signs of deflation, which helped cause Japan's "lost decade", could undermine the yen

Analysis

The Japanese Yen outperformed last week as risk aversion and ensuing unwinding carry trades drove demand higher. A bland domestic economic calendar and thin liquidity conditions around the Thanksgiving holiday in the US leave the chance for coming volatility. Growing signs of deflation could undermine JPY, especially if there's no stock pullback to stoke demand for safe haven currencies.

Events

Although there's adequate scheduled event risk on next week’s docket, the market-moving potential of upcoming releases is limited.

  • The Bank of Japan’s monthly report is unlikely to yield much more clarity than the most recent interest rate decision.
  • An up-tick in the jobless rate after three consecutive months of moderation coupled with parallel declines in retail trade and household spending will reflect now-familiar concerns about the ebbing effects of fiscal stimulus, not surprising given the central bank’s steady warnings about a weak consumption outlook.
  • Similarly, another negative annual consumer price index print is expected after both monetary and fiscal authorities acknowledged the economy has fallen back into deflationary territory last week, with the BoJ adding that rising oil prices will offer help in that regard in the months to come.

The trend of risk assets seems likely to be a far more likely catalyst for price action. Although the earnings season is winding down, the early-week US calendar offers a healthy dose of market-moving releases that could shake things up on Wall St and translate into Yen volatility. In particular,

  • The second revision of US third-quarter GDP is expected to be trimmed to 2.9% from the 3.5% initially reported, and should show lower personal consumption levels.
  • Consumer confidence, new home sales, and durable goods orders data is also on tap.
  • Thursday’s Thanksgiving holiday means thin liquidity conditions that make a move over key support and resistance levels more likely.

This is especially important for USDJPY, where prices are flirting with trend-defining double bottom support around 87.09-88.23.

GBP

Pound Forecast Still Bearish Ahead of UK GDP Revisions

Summary

Pound Outlook: Bearish

- Key Events: Tues.-Total Business Investment q/q, Wed.-GDP q/q, CBI Distributive Trades q/q

- UK CPI rose more than expected in October to 1.5% from 1.1%

- The BOE’s meeting minutes showed that the MPC voted 7-1-1 to expand the APF by £25B

- The OECD suggested the BOE keep rates at a record low until 2011

- Threat of further QE, stock pullback could further pressure GBP

Analysis

The Sterling lost 1 % against the US dollar and nearly 2 % vs. the yen over the past week as the minutes from the Bank of England’s November meeting led the markets to price in fewer rate increases over the next 12 months. The vote showed that seven Monetary Policy Committee members voted to expand the Asset Purchase Facility (APF) by £25 billion to £200 billion, but one voted for no change while another voted to increase the APF by £40 billion. This suggests that the BOE may be open to expanding the APF later on, and belief in this possibility will increase on more disappointing news.

Events

The potential for bad news is there.

Tuesday’s data is expected to show that total business investment fell for the fifth straight period in the third quarter, this time at a rate of 3.9 percent. Companies that aren’t investing aren’t likely to be experiencing improved activity or hiring workers. While the BBA’s measure of loans approved for house purchases is projected to rise for the seventh straight month in October to 44,000 from 42,088, , it's hard to be optimistic about spending when growth and employment are still struggling.

On Wednesday, the second reading of UK GDP for the third quarter is anticipated to be revised slightly higher to a quarterly rate of -0.3 percent from -0.4 percent, and an annual rate of -5.1 percent from -5.2 percent. This will continue to reflect the sixth straight quarter of contraction, and the only way the British pound is likely to respond in a positive way is if quarterly GDP surprises and rises.

With US markets will be closed on Thursday for the Thanksgiving holiday and closing early on Friday, volumes will be lower than usual, which may contribute to either flat price movements or extremely choppy trade. The latter may dominate, though, because US event risk will be high. Also, from a technical view, GBPUSD could be in for further declines, as the pair’s break below a rising trend line drawn from the October 13 lows and bearish weekly candle chart formation suggests a bearish outlook on GBPUSD.

CHF

Swiss Franc Could Break Higher As Fear Rises Despite the SNB's Efforts

Summary

Swiss Franc Outlook: Neutral/Positive

- Key Events: UBS Consumption Indicator, Unemployment y/y, KOF Nov. Leading Indicator

- Swiss Monthly Retail Sales Down Again, By 1.6%

- October trade balance surplus up to 2.46 billion from 1.91 billion as exports gained 0.1%

- Moving with risk sentiment, if stock pullback deepens even SNB intervention my not prevent a rise

Analysis

The Swiss Franc trended lower during the past week against the dollar showing potential to break from its current range but hit resistance at the 50-Day SMA at 1.0217. Price movements have stayed below this level since August 12 and a break above would suggest upside potential. Traders worried that current valuations have outpaced underlying fundamentals have generated safe-haven flows and support for the USD/CHF. Weak Swiss fundamental data added to the bearish franc sentiment as retail sales dropped by 1.6%, reducing hopes for domestic growth, as consumers battling rising unemployment continue to retrench. A 0.1% rise in exports was encouraging but not enough to offset weakness generated by falling equity markets.

The OECD raised its GDP forecast for the economy, predicting growth by the end of 2009 offsetting earlier weakness for a net decline of 1.9%. Momentum is expected to carry into 2010 and 2011 which are expected to see gains of 0.9% and 1.9% respectively. SNB Chairman Jean-Pierre Roth said on Tuesday that 2010 will still be difficult for the Swiss economy, which will not recover quickly. He went on to say that "we have the have the necessary means to withdraw liquidity from markets.” The comments take on more significance with ECB president Trichet signaling that it is time to start withdrawing some stimulus that supported the financial system through the credit crunch. Swiss policy makers aren’t expected to alter monetary policy in the near-term because they're still concerned about deflation as the rising Franc continues to depress import prices. Additionally, policy makers are determined to defend the Swissie against appreciation in order to support demand for exports.

Events

If fears grow that a double dip in growth is ahead we could see traders look to lock in profits in front of the long weekend sending equities lower and pushing up the Franc against higher risk currencies. The prevailing uncertainty could see markets quiet leaving the USD/CHF within its current range between 1.0050-1.0200.

The weeks' calendar has potential to influence price action with consumption, employment and growth data coming. The UBS consumption indicator remains near a six year low and considering the sharp decline in retail sales we could see continued weakness in demand. As anywhere, quarterly employment figures may have the most market moving potential as rising unemployment has crippled domestic growth. The only positive report might be the KOF leading index which continues to point toward an improving economy and last month rose to its highest level since 02/08.

CAD

Canadian Dollar Tracking Oil & Stocks Lower

Summary

Canadian Dollar Outlook: Bearish

- Key Events: Mon.-Retail Sales m/m, Fri.-Current Account

- Consumer inflation turns positive, but BoC officials caution against calling an economic recovery

- The slowing pace in USDCAD matches a similar dip in crude, but is this still a tradable correlation?

- Can USDCAD continue its rise to a real reversal or will the pair flop back into a range?

- More risk downside than upside because it behaves as risk currency yet lacks the higher yield

Analysis

Despite lacking the higher rates of a carry currency; the loonie has long moved with the high-yielding Australian and New Zealand dollar, because oil moved on the same growth story as these other commodity currency, and oil drives the loonie. Thus it's no shock to see the CAD drop with oil and stocks while the AUD and NZD also fall on risk aversion. However, a special bond to the US dollar as well as uncertain monetary policy can complicate these correlations.

As usual, Canadian dollar will follow general risk trends as these play out through its relation to oil and equities. Though its lending rates are near zero) and the economy’s recovery is still in progress; it has enjoyed all the tangible benefits of a carry currency like the Australian or New Zealand dollar due to the primacy of oil exports. Thus if we see a significant drop in risk appetite, the Canadian dollar is likely to fall with it.

Aside from risk appetite, the assessment of the loonie’s fundamental strength lies in the same fundamentals (growth, interest rates, monetary policy)to which every other currency responds. Compared to the much higher yielding AUD and NZD, the CAD has little carry trade appeal, and its safe-haven low rates are not likely to rise soon. This past week, BoC Governor Carney reiterated his intention to maintain rates at 0.25 percent as long as inflation stayed low. Backing the policy authority up, the OECD recommended in its semi-annual economic assessment that the bank keep rates near zero until June of next year and perhaps longer.

The OECD offered a modest outlook on economic activity, saying a recovery began in the summer and was gaining traction; but the jobless rate would continue to rise into 2010, thus restraining expansion. Carney was more bearish, saying it was too early to call a recovery and that the CAD was stronger than what fundamentals supported, thus undermining a more robust recovery.

AUD

Stalling With Risk Appetite, Vulnerable To Interest Rate Expectation Disappointments

Summary

Australian Dollar Outlook: Neutral/Bearish

- Key Events: Monday-Conference Bd. Leading Indicators, Tues.-DEWR Skilled Vacancies m/m, Construction Work Done Q3, Wed.-Private Capital Expenditure Q3

- RBA Policy Outlook Remains “Open Question”

- Westpac Leading Index Improves For Fourth Month

- Wage Growth Slows In Third Quarter

- Vulnerable to stock pullback, possible interest rate increase disappointment

Analysis

The Australian dollar rose to yet another yearly high of 0.9408 earlier this week following the rise in risk appetite however; it may have topped in November as investors scale back expectations for higher interest rates in the $1T economy. However, because the rally remains near the 50-Day SMA at 0.9015, we may see the AUD/USD retrace the four-day decline over the following week if markets stick to range trading.

The Reserve Bank of Australia meeting minutes fed speculation that the central bank may hold a neutral policy going into the following year and slow the pace of rate increases and the drop in the interest rate outlook may pressure the AUD. Credit Suisse overnight index swaps shows investors are pricing a 62% chance for a 25bp rate hike next month, down from 83% in the prior week, while traders believe the central bank will raise borrowing costs by nearly 140bp over the next 12-months as policy makers maintain their dual mandate to ensure price stability while fostering full-employment.

The RBA said “business and consumer confidence could prove fragile” over the coming year and saw a risk for a protracted recovery as the government stimulus begins to taper off, and went on to say that the direction for monetary policy “remained an open question” as the board aims to balance the risks for the economy. In addition, the central bank repeated its concern that the appreciation in the Australian dollar is likely to “constrain output and dampen inflationary pressure” going forward, but simultaneously, the RBA argued that “a lengthy period with interest rates at a very low level carried its own risk” as the economy skirts the global recession.

Meanwhile, the Organization for Economic Cooperation and Development raised its economic outlook for the region and expects the growth to increase at a yearly rate of 2.4% after an initial forecast for a 1.2% rise in June, and the group expects to see “a gradual tightening of monetary policy” going forward as growth prospects improve.

Events

As a result, the Aussie calendar for the following week could feed increased volatility in the exchange rate as economists predict business spending will rise 1.0% in the third-quarter after expanding 3.3% during the previous three-month period, while construction outputs are anticipated to hold flat after falling 0.1% in the second quarter.

NZD

New Zealand Dollar Vulnerable Due To RBNZ Independence Threats

Summary

New Zealand Dollar Outlook: Bearish

- Key Events: Wed.-NBNZ Business Confidence, Thurs. Trade Balance Survey

- New Zealand dollar tumbles, hobbled by interest rate expectations, waning risk appetite

- Debate over RBNZ mandates also pressure the NZD

- Worst performing G10 currency last week, vulnerable to stock market corrections, trade balance disappointment could fuel debate over central bank policy and further damage the NZD

Analysis

Easily the worst performing G10 currency, the NZD fell against all major counterparts to end the week’s trade. It faded with the rest of the risky asset classes, while fairly bearish interest rate developments compounded NZD losses. New Zealand’s opposition Labour Party leader withdrew his party’s support for an incredibly important facet of Reserve Bank of New Zealand policy. Increased discontent with New Zealand dollar appreciation has led many politicians to question the RBNZ’s inflation-targeting policies—calling for the central bank to control exchange rate fluctuations. While the opposition party currently trails the ruling National Party in opinion polls, this is nonetheless a legitimate threat to RBNZ independence and could hurt confidence in the domestic currency.

Events

Barring major market shocks, a light economic calendar in the week ahead could keep traders focused on political developments, and it remains critical to monitor the ongoing debate on the RBNZ. Thursday’s Trade Balance result is a key exception, and could influence the ongoing RBNZ controversy. Forecasts call for a sizeable NZ$480 million deficit for the month of October—the second-worst result for the past year. New Zealand exporters have been hurt by the strong exchange rate, and a large deficit could embolden the opposition against RBNZ inflation targeting. Traders should watch markets’ reaction to the data.

The New Zealand Dollar appears likely to remain volatile in the week ahead—especially as it remains near significant peaks against the USD. It is easy to forget that the NZDUSD had rallied by nearly 60 percent off its lows, and such incredible strength leaves it vulnerable to a large correction. It is now only 5 percent off of its 2009 highs, but any further news to suggest the RBNZ will target the New Zealand Dollar exchange rate could easily force a much larger drop.

CONCLUSIONS

  1. If the S&P 500 remains in a flat range, expect most other asset classes to behave likewise.
  2. If it dives, that will favor the safe haven JPY, USD, and CHF in that order, against the higher yielding and commodity currencies, as well as against the EUR, which typically moves opposite the USD. Short other risk assets like stocks, oil, and possibly gold. As always, wait for some confirmation of the downtrend.
  3. If it breaks past the 1100 resistance level, long risk assets and currencies, short the JPY, USD, and CHF.

Because the S&P remains at a possible trend reversal level given that it is still near 1100 resistance and still may be forming a bearish double top formation, traders and investors should be cautious about opening new positions until we have a clearer picture of overall market direction, and have stop loss orders in place to protect profits when not able to actively watch markets.

DISCLOSURE: The author has no open positions in the above instruments. Opinions expressed are not necessarily those of avafx.